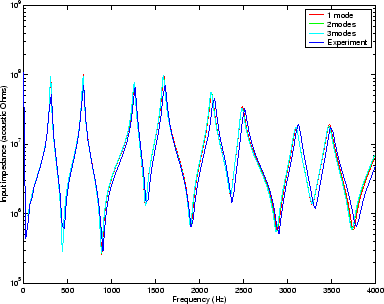
The input impedance of the stepped tube object was calculated from the measured input impulse response shown in figure 5.7 using equation (5.7). This result is shown in figure 5.8. Also shown is the test object consisting of stepped cylinders plotted against the multimodal theory results. These results were generated using the method described in chapter 4.
The agreement is very good between the plane wave calculation,
the two mode calculation and the three mode calculation showing that the
effect of higher modes is not significant in the frequency range we are
considering. In fact, the lowest cut-off frequency is that belonging to the
mode with one nodal circle in the wider of the two cylinders. This has a
frequency of
![]() kHz, considerably higher
than the range of interest. The higher modes are therefore all strongly
exponentially damped in the object and, similarly, very little mode conversion
takes place at the discontinuities and at the open end.
kHz, considerably higher
than the range of interest. The higher modes are therefore all strongly
exponentially damped in the object and, similarly, very little mode conversion
takes place at the discontinuities and at the open end.
The experimental and theoretical input impedance peaks agree best at low
frequencies, with the deviation increasing as frequency is increased.
In fact, the experimental peaks are at higher frequency than the
theoretical peaks by a factor of
![]() .
A calculation of the musical pitch interval implied
(see [1]) gives an answer of around 17 percent of a semitone.
Notice that the theory assumes that the object is terminated
in an infinite baffle and no baffle was used in the experiment.
The length correction at the open end for a baffled duct is slightly
larger than the end correction for the unbaffled duct, hence the
theoretical result (which assumes a flange) has lower frequency
resonances than the experiment (which was on an unbaffled object).
Still, the reasonable agreement between experiment and theory indicates
that the resonance peaks are sufficiently well defined by the
geometry of the object to ensure that the effect of small changes at the
open end is minimal.
.
A calculation of the musical pitch interval implied
(see [1]) gives an answer of around 17 percent of a semitone.
Notice that the theory assumes that the object is terminated
in an infinite baffle and no baffle was used in the experiment.
The length correction at the open end for a baffled duct is slightly
larger than the end correction for the unbaffled duct, hence the
theoretical result (which assumes a flange) has lower frequency
resonances than the experiment (which was on an unbaffled object).
Still, the reasonable agreement between experiment and theory indicates
that the resonance peaks are sufficiently well defined by the
geometry of the object to ensure that the effect of small changes at the
open end is minimal.
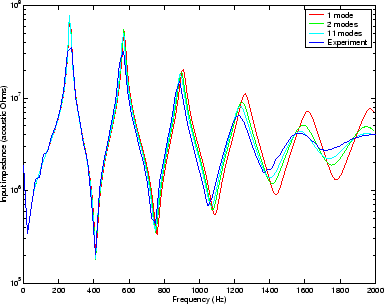
Figure 5.9 shows the experimentally measured input impedance
of the trumpet bell section described in section 4.3.
The experimental data is plotted against the results of multimodal theory.
Because the theory assumes that the object is terminated in an infinite
baffle, in order for experimental results to verify the accuracy of the theory,
the experiment was performed with the trumpet section opening out
onto a circular hole in a square hardboard baffle section of width 1 m.
This time there is a significant drop in the sharpness and position of the
higher frequency resonance peaks when more modes are
included. The lowest cut-off frequency is the one nodal circle mode at the bell
which has a frequency of
![]() Hz. All the
modes are therefore still in cut-off throughout the frequency range of
interest. The fact that there is a significant difference in the plane wave
impedance depending on how many modes are included indicates that a
significant amount of energy is lost by conversion of plane waves into the
evanescent higher modes.
Hz. All the
modes are therefore still in cut-off throughout the frequency range of
interest. The fact that there is a significant difference in the plane wave
impedance depending on how many modes are included indicates that a
significant amount of energy is lost by conversion of plane waves into the
evanescent higher modes.